Assignment Snapshot: Analyze the attached Facebook Analytics and email analytics from a real company. Review the provided analytics, and tell us your thoughts. Background: ABC company* is health-oriented and in the Central Florida area. In addition to this Facebook page, ABC company has a Twitter account, Pinterest page and YouTube channel. ABC Company also sends out a bi-weekly e-newsletter. You are looking at analytics for their Facebook page during the time period noted on the screenshot (the email stats are from an email sent on May 21, 2013). Based on the provided analytics and what you learned about IMC, provide a synopsis of what you are looking at for both their Facebook page and email campaign. Any key findings? Where could improvements be made? How could other channels play a part in boosting results? What are some future campaigns or posts that could be effective? *Company identity withheld for the purpose of this project and this project is purely for educational purposes.
So I’m the creative type. I like imagining and visualizing and stretching ideas into really cool things. It’s why I swan-dived into television storytelling. In that world, Nielsen is the almighty judge, jury and executioner or savior. While I am not someone who wants to spend all the minutes of my hours of my days mired in data, I do understand it is a necessary evil. It is also the best indicator as to whether or not all that artsy-fartsy, creative juju I’m so in love with doing is worth a damn to YOU.
It’s no different in social media which brings us to this week. You will see the data I am analyzing below in thumbnails. You can click on them to enlarge. I have also included them within this entry. The gallery works better on some devices, the large photos on others.
The Facebook Insights data presented represents a period of time leading up to and including Memorial Day Weekend. The “Overview” numbers at the top reflect the last seven days of data. The program does this by default. The line charts below it represent May 6 through May 25, 2013. The “Reach” reflects data from April 28 through May 25. The “Talking About This” reflects data from April 28 through May 25.
Additionally the data shows a synopsis of posts for the week of May 27through June 2.
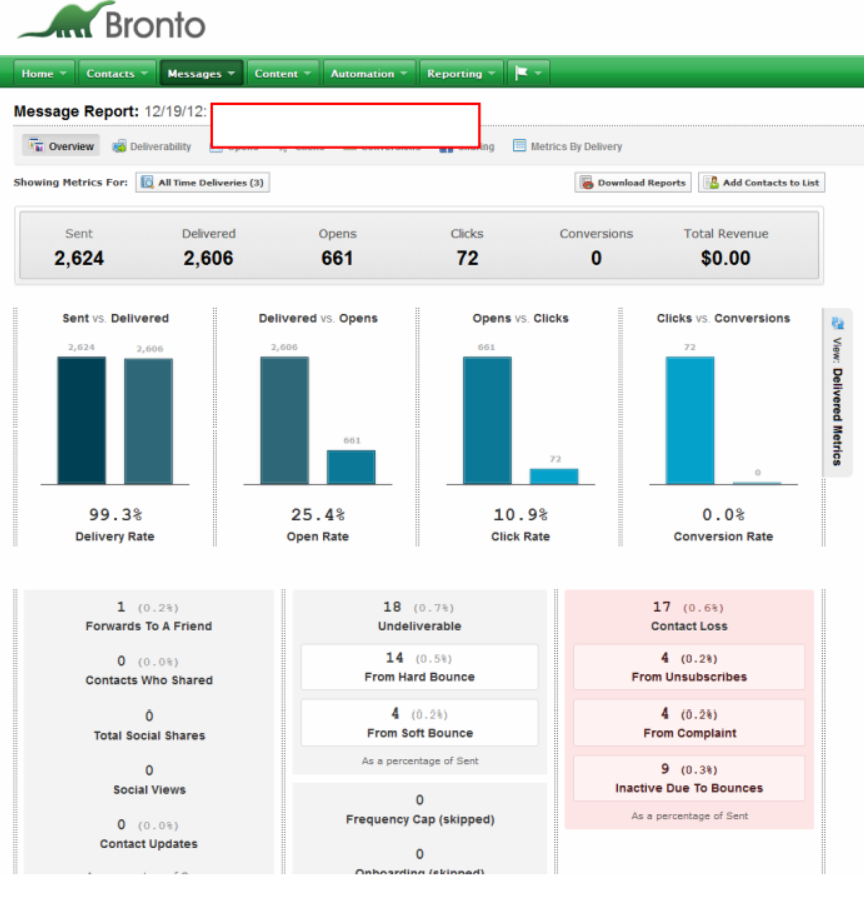
For the purpose of this exercise the Bronto email data is from an email sent on May 21, 2013 not December 19, 2012 as the report itself reflects.
THE DATA: Overview Page
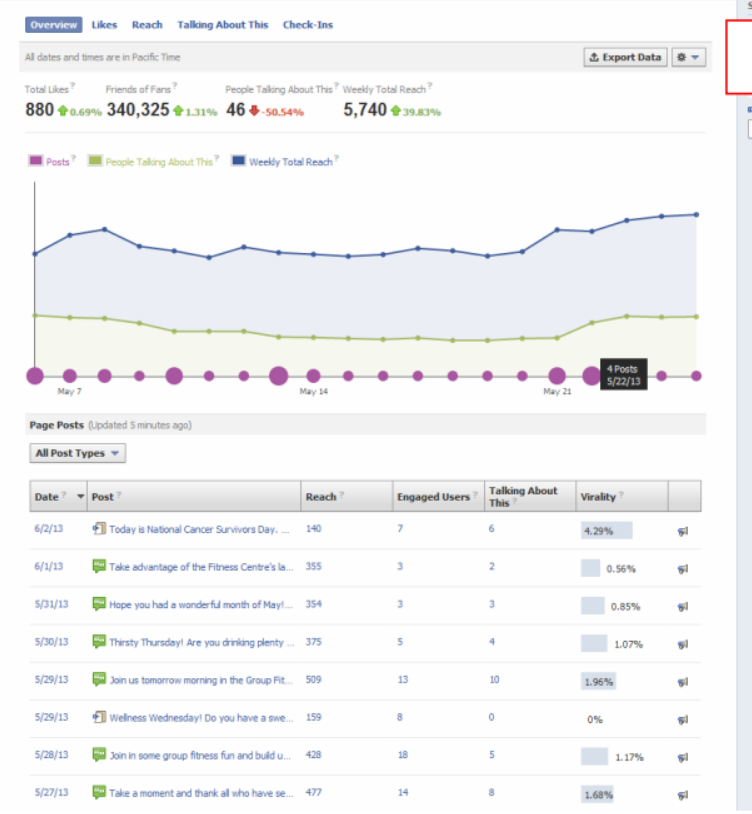
Overview Page: Facebook Insights analytics from a real company
During the time of this data, the company’s page received 880 total likes, up .69% from the previous 7 days.
The Friends of Fans is up 1.31% to 340,325. This metric show an estimate total of potential audience when counting the friends of those who liked this page. This metric was deemed not very useful and was removed in July of 2013. Basically, a page would only reach this amount of people if ALL their fans engaged with the post and then by extension…all their friends saw the post.
The People Talking About This is down to 46 total, a drop of 50.54% from last data period. These are the people that liked, commented or shared a post from this page or basically engaged in some way with the page.
The weekly total reach for May 19 through May 25 is up 39.83% for a weekly total reach of 5,740. This is not only the page, it includes ads and sponsored stories. This could reflect people looking for a fitness club while potentially traveling to the high tourist area for the holiday weekend. There is further data to support that which I will address in other metrics.
The overview page also reflects data for 8 posts the week of May 27 (Memorial Day) through June 2. These vary from inspirational messages, reminders, promotion and encouragement.
The reach of the posts increased midweek as we moved away from the holiday reflecting the possibility of people returning to their exercise routine. Additionally, while the reach was lowest on the National Cancer Survivors Day, the virality of the post was the highest in terms of ratio percentage. People love a cause.
The reminder to honor the soldiers for Memorial Day had a strong reach of 477 and the 2nd highest number of engaged users in that 14 people clicked on it and 8 of those people took the time to share or re-post or comment on it.
The two Group Fitness posts for May 28 and 29 had high reach numbers with the 29th reaching the most people for the week. In turn, those two posts had the 1st and 3rd most engaged users in direct numbers with the post on the 29th leading to the highest numbers in People Talking About This.
Overall, trying to get people to participate in Group Fitness, the holiday and the national campaign garnered the most attention.
THE DATA: Reach Page One
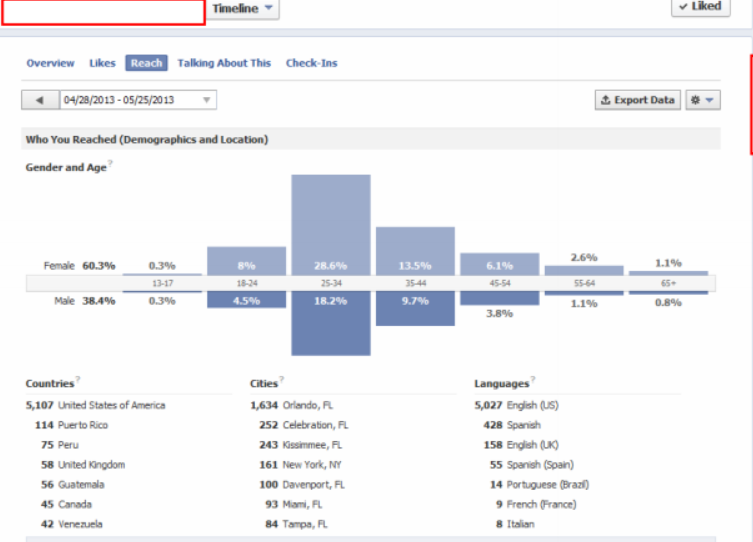
Reach Page One: Facebook Insights Analytics from a real company
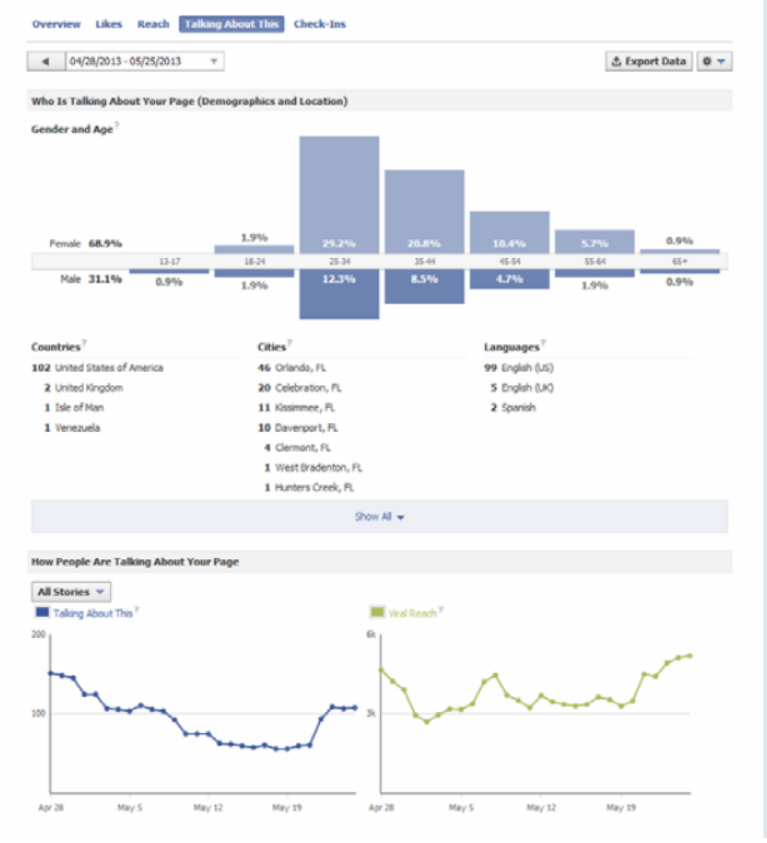
The key finding here is that the site engages women predominantly to the tune of 60% with the biggest group being 25 to 34 years old and the next largest group being 35 to 44. Depending on the goals of this particular company, you could develop a campaign to target more men without losing women or you could continue to focus on a deeper engagement with women.
I would be curious to know whether the country, city and language data reflects as much diversity in a non-holiday week. I imagine these numbers are high during the summer and other peak travel times.
Orlando is a hot holiday destination so it is no surprise to me that numbers outside of Florida are high during this time. People could be looking for a workout facility while traveling for the holiday weekend.
THE DATA: Reach Page Two
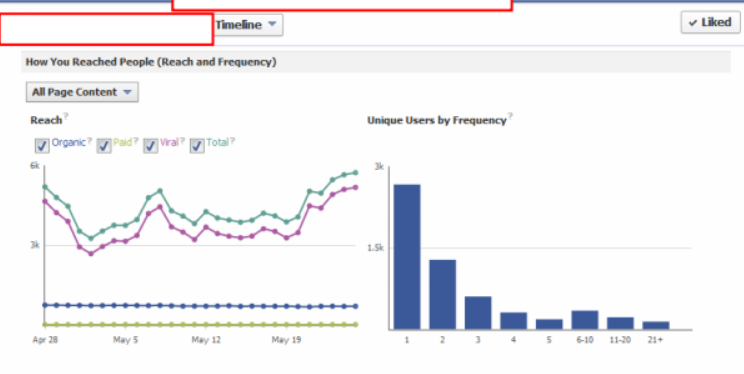
Reach Page Two: Facebook Insights Analytics from a real company
The color dotted lines at the top of the page reveal how the page is reaching people. Viral and Organic lead the way with Viral performing at a higher number. Viral means that a user viewed your page and then pushed content out to their own feed. Organic is when someone just sees your page as is. Based on the flat line for paid content I am assuming no ads were purchased during this time frame.
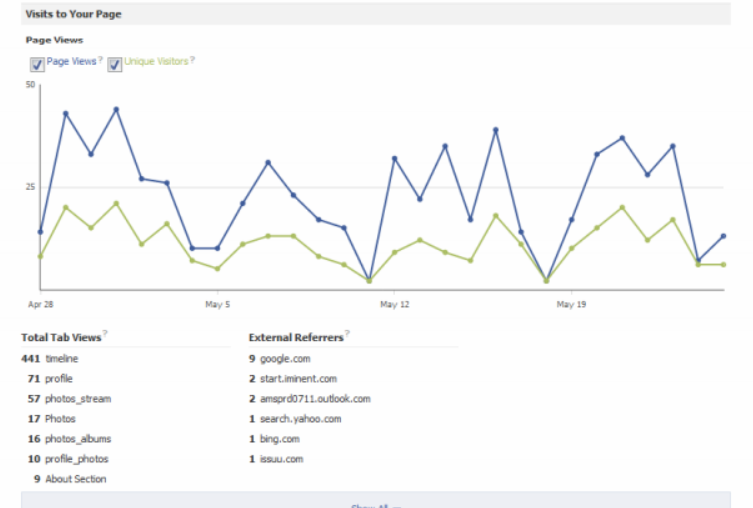
The bar graph on the top right reflects the unique visitors to the page with nearly 3 thousand unique visitors coming to the page once during the data period. The bottom line reflects the amount of time unique visitors frequented the page for the given time period.
The dotted lines at the bottom of this page (above) show page views for the period and highlight which ones were unique. The views including uniques see a spike when the bi-weekly email is sent out.
Most of the traffic comes in from search with the most entering from Google. the second source is a virus/malware page. The other 2 non-search referrers are email and one from a digital publishing platform, possibly a blog.
The timeline is the most popular feature of the page above all else with the profile and photo streams also showing strong engagement.
THE DATA: Talking About This
Talking About This: Facebook Insights analytics from a real company
It’s no surprise given reach that the most engaged users are also women in the 25 to 34 and 35 to 44 age range. They speak English and the cities with the most activity are in Florida.
The blue dotted line reflect the days and numbers that users or followers of the page are engaging. The green shows the reach to users who were exposed to your page from a post by someone else. These numbers also seem to spike in relation to the bi-weekly email campaign.
THE DATA: Email Analytics
Bronto email analytics from a real company
The delivery rate for this email is strong but given the little spike seen in the Facebook page coinciding with the email newsletter, I would have expected the open rate to be higher.
Hard bounces reflect things like an invalid email address or the email flagged as spam. Soft bounces are considered more temporary such as a server issue or a full mailbox. It can be an early indicator of an abandoned email though.
My greatest takeaway from this is that clearly this newsletter isn’t full of compelling content worth sharing.
Improvement Possibilities
I think one improvement possibility is looking at the content in the newsletter. Clearly it is not driving people to share it. First…is there social share buttons in the email? If not, I would add them. Then start to take notice of the social share and social view stats.
With the email open rate being low and the click rate being lower, I would take a look at subject lines. Do they give your regular user a reason to open it? Then look at your links. Do they give your user a reason to click? That’s an area that can easily be focused on with no cost and could help with Facebook numbers.
Looking at the male to female ratio, this company could have a day of the week where they devote a post campaign targeted to men to elevate those numbers.
Group Fitness seems to be of high interest as well. I would consider creating more Group Fitness opportunities and posting about them.
Since there did not appear to be paid content driving traffic based on the data, the company could look at buying ads in high tourist times as a good destination for the fitness-conscious traveler. Google search was the biggest external referer but an ad could drive that number up more. If there is a budget allowance ads could be purchased of Facebook to attract women looking at various fitness pages.
How Twitter, Pinterest & You Tube could play a part in boosting results & Future Campaigns and Posts
TheTwitter account could affect these results by including a link to Facebook with every tweet. I don’t know how many Twitter followers this company has but if you send a tweet offering something with added value by clicking on a link, you could increase traffic. Fitness people are dedicated and some are even fanatical. They like added value. Promise 5 tips to something or 3 ways to something…
Additionally, you can make the same promise via twitter by getting fitness people to subscribe to the email and boost those numbers. Again, fitness people want good information delivered to them. It’s a chance to create a loyal social following who may never set foot in your business but values your content.
We know that women love Pinterest. We know that women are engaging in this Facebook page and that it is reaching more women than men. Pinterest could definitely be playing a role in that if this company is good at maintaining its content on Pinterest. I would continue to focus on that added value for the fitness person. The company could use Twitter as its mechanism to drive traffic to both locations. It could diversify its content by making the Pinterest page about fitness fashion and nutrition. It could post that information for users and have a board for users to post their content.
The company could then use the Facebook page to highlight specific exercise, fitness, workout tips, etc. Keep the Facebook page focused on the workouts, exercise and events at the company. Keep Pinterest for fashion and nutrition and DRIVE to Facebook for the other content. Twitter becomes the catch-all referer with links always included.
Finally, if there is a You Tube account then there is a Google+ account. That is a default of creating a You Tube account. First, I would make sure the Google + page has content. We all know this is great for SEO to have something on Google+.
You Tube could be used as a place to demo/provide tutorials on various fitness activity. The videos can then be posted to Facebook. With You Tube being owned by Google, the company could properly tag videos with key words increasing the chance that search for such tutorials or fitness content would land people on the Facebook page.
One final recommendation for this company…start a blog. Promote the blog in email and on Facebook. Fitness is a GREAT area for blogs and as I said, fitness people are passionate about their fitness! It’s a good opportunity for this business to make itself into a content source. When you are a business in a HUGE tourist location, the chances that you are going to have a handful of temporary brick and mortar clients is high. So why not capitalize on that and make yourself a source for fitness expertise? You keep the travelers loyal to your brand. You build your local base. You continue to expand and grow. It’s a win-win.